&
AUTHORSHIP
INTERACTION
MAIN PROJECT
PROCESSING
V & A
LIBRE GRAPHICS
CONDITIONAL DESIGN
01
02
ARDUINO
In this section of my 'Authorship and Interaction' module, we were introduced to computer processing; particularly looking at an online website named 'Hello processing'. This online platform includes a series of introductory tutorials on how to create visual pictorial outcomes, using code.
I initially began watching and interacting with the tutorials prior to developing my own outcomes.
Above and some examples of the techniques and final outcomes which we learn whilst watching the series of videos.
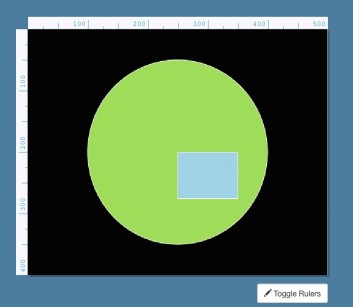

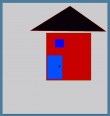


Above is a completed creation of a simple house formed from basic 2-dimentional shapes. I was able to achieve this outcome using a sequence of codes and 'rules'. For example Void draw() {, followed by 'stroke', 'triangle' and their coordinates would correspond to form a triangular shape.
Each shape; its size, positioning and chosen colour were also created using a series of codes. (see left) Throughout the 'Processing and Data visualization' workshop, many attempts were made to achieve a somewhat symmetrical house. I continuously altered the size of the roof (triangle) with the intention to position it centre to the square. Finding difficulty to do so, I believe the final outcome to be a personal achievement.
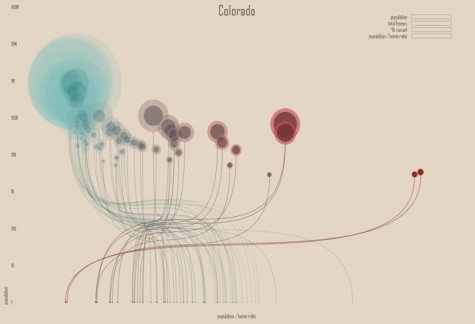
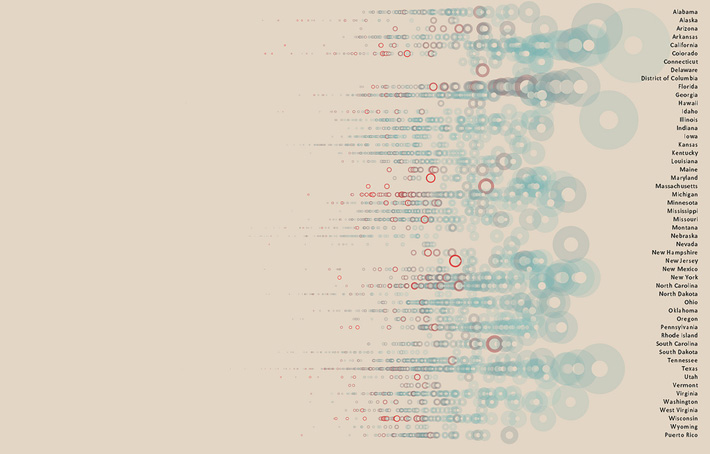
The work 'Ghost Counties' created by designer 'Jan Willem Tulp' is a great example of how Data gathering can be used to create display remix outcomes. Her work displayed on the right represents her statistics taken from the 'U.S. housing market'. To view more of her work click her name below:
Jan Willem Tulp
JAN WILLEM TULP
03
04
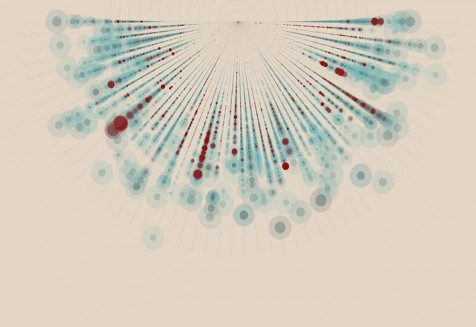
After viewing other possibilities of data visualization, we were set a task to create are own visual outcome. Continuing to use 'Processing' as a digital platform, I inserted the data shown above from excel spreadsheet to develop a corresponding code (see left). When the code was inserted and then processed in Processing ; a pattern of various sized circles emerged. Similar to the work of Jan Willem Tulp, I was able to create my own unique data.
I found it interesting that the data / statistics I originally imported could be represented using just a few circles and labels. To ensure that audiences viewing my data could understand its representation I think a key would be beneficial.
Code Elements
Syntax Introduced:
● //Comment)
● /* Multiline Comment /*
● “;” Statement terminator
● “,” Comma
● print(), println()
Code Elements
Functions allow you to:
-Draw shapes
-Set colours
-Calculate numbers